

Here's a thing I didn't expect to be typing a year ago: I open my morning charts by talking to my trading platform. No clicking through menus, no saving a template and loading it. I type "open ES and NQ 5-minute charts, put Volume Profile and Footprint on both, and pull up a SuperDOM for ES," and it happens. Later in the session I'll ask "where do I stand?" and get my accounts, positions, and working orders read back with the risk summarized. If I mean it, I can even say "flatten my NQ position" and it does that too, through the same buttons I'd click myself.
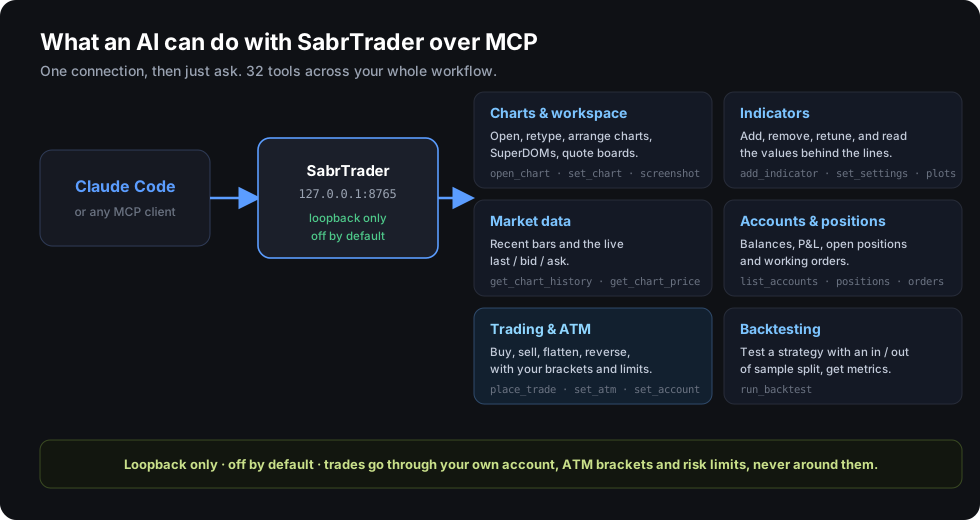
That's the SabrTrader MCP server. Flip it on, point an AI client like Claude Code at it, and you can drive the whole platform in plain English. Charts, indicators, market data, connections, accounts, positions, orders, ATM brackets, backtests, and actual trades. There are 32 tools today. This guide walks through every one of them: what it does in plain language, when you'd reach for it, and the kind of sentence you'd actually type to trigger it. This is about what you can do once it's on, not the wiring underneath. You won't need any of that.
Table of contents
- 1. What the SabrTrader MCP server is
- 2. Turn it on and connect
- 3. What you can ask it to do
- 4. Example sessions end to end
- 5. Full reference table of all 32 tools
- 6. Safety and staying in control
- 7. FAQ
- 8. Where to go next
1. What the SabrTrader MCP server is
MCP is the standard that lets an AI assistant call into an app. SabrTrader ships an MCP server built in. When you turn it on, it exposes those 32 tools, which are just named actions the AI can take on your behalf. You never call them by hand. You describe the outcome you want, and the assistant picks the right tool, fills in the details, chains a few together if it needs to, and tells you what it did.
The pitch is simple. You get an AI trading assistant that can see your workspace and act on it. Want to connect Claude Code to SabrTrader and run your charts by voice? That's the core of it. Want the AI to read your market data, check your positions, or place a trade the same way you would by clicking? That's here too. A few asks that work today, to make it concrete:
- "Open a 5-minute ES chart and add the Volume Profile."
- "What are my open positions and P&L right now?"
- "Flatten my NQ position but keep the bracket on the ES trade."
- "Screenshot this chart and tell me if the setup looks clean."
- "Backtest my breakout strategy over the last two years with an out-of-sample split."
You're talking to your platform. That's the whole idea. Why does this beat a hotkey or a saved template? Because you don't have to decide the exact sequence ahead of time. A template loads one fixed layout. A hotkey does one fixed thing. Here you describe the result and let the assistant work out the steps, adjust to what's already open, and explain the outcome. When your ask changes, you change the sentence. That's the difference between AI trading automation you can talk to and a macro you have to maintain.
One more thing worth saying up front, because it's the mental shift that makes this click. You're not writing a script and you're not learning an API. You're delegating. The way you'd tell a junior trader "get my morning charts up" and trust them to know what that means, you tell the assistant, and it figures out the sequence. If it gets something wrong, you correct it in words, not in code. That's a different relationship with your platform than a hotkey gives you, and it's why people who try it tend to keep it on.
If you want to see where SabrTrader fits more broadly, the features page covers the rest of the app, and the SDK docs go deeper on building your own tools.
2. Turn it on and connect
Three steps. That's genuinely all of it.
1. Turn the server on in SabrTrader. Go to Settings > Preferences > MCP Server and flip the toggle. It shows you the URL it will listen on (http://127.0.0.1:8765/). Restart SabrTrader so it starts listening. It's off until you do this, on purpose.
2. Register the SabrTrader MCP server with Claude Code. Run this one command in your terminal:
claude mcp add --transport http sabrtrader http://127.0.0.1:8765/Restart Claude Code afterwards. The new tools only show up after a restart. Quit Claude Code and open it again (or reload the window), then start asking. If the tools don't appear, it's almost always because Claude Code wasn't restarted.
3. That's it. Just ask. Claude discovers every tool and works out how to use each one on its own. You don't teach it anything. Start typing what you want.
This isn't Claude Code specific either. It's a standard MCP server, so any MCP client connects the same way. Point Claude Desktop, Cursor, or whatever you already use at the same local URL and you're connected. One advanced note for headless setups: instead of the Preferences toggle you can start SabrTrader with the environment variables SABRTRADER_MCP_ENABLED=1 and SABRTRADER_MCP_PORT set. Most people never need those.
3. What you can ask it to do
This is the heart of it. The 32 MCP trading tools group into a handful of jobs. Below I give each tool its own short treatment: what it does, when you'd reach for it, and one to three prompts you'd actually type. You don't need to memorize the names, but I'll name them so you know exactly what's under the hood.
3.1 See and set up your workspace
This is where I get the most day-to-day value. The AI can see every window you have open, lay out new ones, read and change what's on a chart, and open the specialized windows like the SuperDOM, the Market Analyzer, and the backtest workbench. Twelve tools live here, and they're the ones you'll lean on before the market even opens. The nice part is that the assistant reads your existing layout first, so "switch this chart" or "close the extra ones" means something specific rather than guesswork.
list_windows shows every open window: charts, SuperDOM ladders, Market Analyzer boards, Times & Sales, each with an id. You reach for it whenever the AI needs to know what's already open before it acts, and it's what makes "switch this chart" work, because the assistant can find the right id. You get back a list; other commands point at those ids.
- "What windows do I have open right now?"
- "List my charts so I can pick one to work on."
open_chart opens a live chart for a symbol at a period, with an optional venue. You give it a symbol and a bar spec (like ES and 5m); you get back a chart window you can point other commands at. This is the first thing most sessions do.
- "Open a 5-minute ES chart."
- "Open a 1-hour NQ chart on my futures feed."
- "Pull up a daily chart of CL."
get_chart reads a chart's current symbol and bar type. Use it when the AI needs to confirm what it's looking at before changing anything, or when you ask "what's this chart set to?" It's a read, so it never touches your layout.
- "What symbol and timeframe is this chart on?"
set_chart changes a chart's symbol or bar type while keeping your venue, drawings, and indicators in place. The bar type accepts the usual specs: 5m, 1h, 30s, 1d, 100t for tick, 4r for range, 1000v for volume. Reach for it when you want to flip an existing chart instead of opening a new one.
- "Switch this chart to a 4-range bar type." (keeps everything else)
- "Change this ES chart to NQ."
- "Put this on a 30-second timeframe."
close_window closes any window by id. Simple cleanup, useful at the end of a session or when a layout gets crowded.
- "Close the NQ chart."
- "Close every window except my ES 5-minute."
open_superdom opens a depth-of-market ladder (SuperDOM) for a symbol. You reach for it when you want to watch resting bids and offers rather than a candle chart. You give it a symbol; you get a ladder window.
- "Open a SuperDOM for ES."
- "Give me a depth ladder on CL."
configure_superdom changes a ladder's symbol, price grouping (ticks per row), row height, and similar display settings. Use it to tune the ladder to how you read it, for example grouping several ticks into each row on a fast market.
- "Group the ES ladder two ticks per row."
- "Make the SuperDOM rows shorter so I see more depth."
open_market_analyzer opens a quote board, the grid of symbols with live columns. Reach for it when you want a watchlist view instead of individual charts.
- "Open a Market Analyzer."
- "Give me a quote board for my index futures."
market_analyzer_add_symbol adds a row to that quote board. You point it at the board and give it a symbol.
- "Add NQ and RTY to the quote board."
- "Put GC on my Market Analyzer."
market_analyzer_remove_symbol removes a row from the board. The obvious counterpart when you're trimming a watchlist.
- "Take RTY off the quote board."
open_strategy_analyzer opens the backtest workbench window. You'd use it when you want the full workbench in front of you, though for a quick test you can skip straight to run_backtest (see 3.7) without opening anything.
- "Open the Strategy Analyzer."
- "Bring up the backtest workbench."
screenshot_chart captures a chart to an image the AI can actually look at. This is the one that surprises people. The assistant reasons about the picture, so you can ask about structure, not just numbers, and you also get a clean image back for your own notes.
- "Screenshot the ES chart and tell me if this breakout looks real or just noise."
- "Capture this chart so I can drop it in my journal."
Key tools in this group: list_windows, open_chart, get_chart, set_chart, close_window, open_superdom, configure_superdom, open_market_analyzer, market_analyzer_add_symbol, market_analyzer_remove_symbol, open_strategy_analyzer, screenshot_chart.
3.2 Work with indicators
Six tools cover the indicator lifecycle: add, list, remove, read settings, change settings, and read the actual output numbers. Because the AI can both set parameters and read the values back, you can have a real conversation about what an indicator is telling you. That last part is the quiet upgrade. Most tools that "add an indicator" stop at drawing it. Here the assistant can read the numbers off the plot and factor them into an answer, so "is price above or below VWAP right now, and by how much?" is a question it can actually answer instead of describing what it sees.
add_indicator adds any indicator from the catalog by its key (for example VolumeProfile or FootprintIndicator), with optional parameter overrides. You give it a chart, an indicator key, and any settings you want changed from the defaults. Reach for it constantly, it's how studies land on a chart.
- "Add the Volume Profile to this chart with a 20-day lookback."
- "Put a Footprint on ES."
- "Add a 21-period VWAP."
list_indicators shows what's already on a chart. Use it before changing or removing something so the AI knows what it's working with, or just to answer "what's on here?"
- "What indicators are on this chart right now?"
remove_indicator removes one indicator from the chart. The counterpart to add, for when a study is cluttering the view.
- "Remove the Volume Profile from this chart."
- "Take the Footprint off."
get_indicator_settings reads an indicator's current parameters. Reach for it when you want to know how something is configured before you tweak it.
- "What's the lookback on my Volume Profile set to?"
- "Show me the settings for the VWAP on this chart."
set_indicator_settings changes an indicator's parameters and recalculates it. This is how you iterate on a study without opening its dialog. Change a length, a source, a color, whatever the indicator exposes, and it redraws.
- "Change the Volume Profile lookback to 10 days."
- "Set the moving average length to 50."
get_indicator_plots reads an indicator's recent output values, the actual numbers behind the lines. This is what lets the AI reason about levels instead of guessing from the plot. You point it at an indicator on a chart and get its latest values back.
- "Read the last few values off my VWAP so I know where it sits."
- "What's the current Volume Profile point of control?"
Key tools: add_indicator, list_indicators, remove_indicator, get_indicator_settings, set_indicator_settings, get_indicator_plots. If you want to build your own indicator to drive this way, the first-indicator walkthrough is the place to start.
3.3 Read the market
Two tools let the AI read price directly, so it can answer questions without you reading numbers off the screen. This pair is what turns the assistant from something that arranges windows into something that can reason about the market itself. Feed it bars and it can find a range, spot where a level formed, or compare today's action to yesterday's.
get_chart_history returns recent OHLCV bars, oldest first. The default is 200 bars and you can ask for up to 5000. Reach for it when the AI needs history to reason about: recent ranges, swing points, where a level formed. You give it a chart and a bar count; you get the bars back.
- "Give me the last 300 five-minute bars on ES."
- "Pull the last 1000 bars so you can find the overnight high and low."
get_chart_price returns the current forming bar plus the live last, bid, and ask. Use it for "where is it right now?" It's the snapshot the assistant reads before commenting on the current tape.
- "What's ES trading at right now, and where's the bid and ask?"
- "How far is the current bar from the day's high?"
Key tools: get_chart_history, get_chart_price.
3.4 Manage connections
Three tools handle your venue sessions, so the AI can bring a feed up before it does anything that needs live data.
list_connections shows your configured connections and whether each is live. Reach for it to check the state of your feeds and brokers, or before connecting so the AI knows what's already up.
- "Which of my connections are live right now?"
- "Is my data feed connected?"
connect_connection starts a live venue session. Use it when a feed or broker is down and you want it up, for example before pulling history or placing a trade.
- "Connect my data feed so I can pull history."
- "Bring up my broker connection."
disconnect_connection stops a live venue session. The counterpart, for when you want to drop a feed.
- "Disconnect my data feed."
Key tools: list_connections, connect_connection, disconnect_connection.
3.5 Check accounts, positions and orders
Five read-only tools, and together they're the fastest way to answer "where do I stand?" Nothing here changes an order or a position, so you can check freely. This is also the group I trust most for a quick sanity check mid-session, because there's no way for a read to move your book. You can ask for a full picture as often as you want, at any point, and know the worst it can do is tell you something.
list_accounts lists every trading account with its mode (LIVE, PAPER, or SIM), currency, cash, buying power, margin used, and realized plus unrealized P&L. One honest detail: realized P&L comes back as null, not zero, when the venue hasn't reported it yet. So the AI won't tell you you're flat for the day when it simply doesn't have the number.
- "List my accounts and summarize my risk."
- "How much buying power and margin do I have across accounts?"
get_account reads a chart's selected account, along with the accounts available to it. Reach for it to confirm which account a chart is pointed at before you trade on that chart.
- "Which account is this chart set to?"
- "What accounts can I switch this chart to?"
set_account switches a chart's selected account. This matters a lot for trading, because place_trade acts on whatever account the chart points at. Move a chart to your paper account while you explore, or to live when you mean it.
- "Point this chart at my paper account."
- "Switch this chart to my live futures account."
list_positions lists open positions across accounts: instrument, size, side, average entry, last price, and unrealized plus session-realized P&L. The go-to for "what am I holding?"
- "What positions am I holding and what's the unrealized on each?"
- "Am I flat or do I still have the ES on?"
list_orders lists working orders across accounts: side, type, quantity, filled and remaining, limit or stop price, and state. Use it to see what's resting in the market.
- "Show me my working orders."
- "Do I have any resting stops or targets right now?"
Key tools: list_accounts, get_account, set_account, list_positions, list_orders.
3.6 Manage ATM brackets and place trades
Here's the part that changed. Earlier versions of this feature couldn't trade at all. Now they can, and it's worth being precise about how. Three tools: two for the bracket, one for the trade.
get_atm reads a chart's current ATM strategy, your stop, target, trailing, and OCO template. Reach for it to confirm which bracket is armed before you enter, so every fill gets the protection you expect.
- "What ATM bracket is on this chart?"
- "Do I have a stop template selected here?"
set_atm picks a chart's ATM strategy, or clears it. This is how you arm the stop/target/trailing template that any entry on the chart will inherit. Set it before you trade, and every position you open through the chart comes with the bracket already attached.
- "Set my ATM bracket to the 2-point stop template on this chart."
- "Clear the ATM strategy on this chart."
place_trade is the important one, so let me be honest about how it works. It can buy or sell at market, close a position (flatten), or reverse, with an optional quantity. It does not build raw orders. It clicks the chart's own Buy, Sell, Close, and Reverse buttons, the exact same buttons you'd click yourself.
That means it inherits your entire safety path. It uses the account the chart is set to. It applies your ATM bracket, so an entry gets its stop, target, OCO, and trailing automatically. And it obeys your risk and wind-down limits: a trade your rules would block is blocked here too, no exceptions. It also reports which account mode took the order, LIVE, PAPER, or SIM, so you're never guessing.
So the honest framing is this. The AI can trade, but only the same way you can by clicking. Only on the account the chart points at. Never around your risk rules, and it can't invent order types you don't have. That's a real capability and a real boundary at the same time.
- "Buy one ES at market." (uses the selected account and armed bracket)
- "Flatten my NQ position."
- "Reverse this trade."
- "Sell two contracts here."
Practical advice before you let AI place trades: point the chart at a PAPER or SIM account while you learn the assistant's habits, keep an ATM bracket selected so every entry gets a stop, and switch to a LIVE account only when you actually mean to trade live. Your risk rules protect you either way, but starting on paper means nothing is at stake while you get comfortable.
Key tools: get_atm, set_atm, place_trade.
3.7 Test a strategy
One tool, and it closes a nice loop.
run_backtest backtests a strategy over a date range: either a saved strategy by name or an inline config you describe. It runs with an honest in-sample and out-of-sample split and hands back headline metrics for both. It's read-only and saves nothing. Judge on the out-of-sample numbers. A big gap between in-sample and out-of-sample is the tell for overfitting, and the assistant will point it out.
- "Backtest my ORB strategy over 2023 to 2025 with a 70/30 split."
- "Run this mean-reversion idea and tell me if the out-of-sample holds up."
- "Test my breakout strategy across the last two years and flag any overfitting."
What I like is the loop it creates. Sketch an idea, ask for a backtest, read the out-of-sample numbers, tweak a parameter, run it again, all in one conversation. You never leave the chat to open the workbench and fiddle with fields. And because nothing gets saved, you can throw ten variations at it without cluttering your saved strategies. The in-sample and out-of-sample split matters more than most people give it credit for. In-sample numbers always look good, because that's the data you tuned on. The out-of-sample slice is the closest thing you get to an honest preview of unseen data, and the assistant reports both so the gap between them is right in front of you. If in-sample is stellar and out-of-sample is mediocre, you've found an overfit, not an edge, and you found it in one sentence.
Key tool: run_backtest. If you want a strategy to test, the first-strategy guide walks you through building one.
4. Example sessions end to end
Individual prompts are fine, but the payoff is stringing them together. The assistant chains the tools for you, so a single sentence can fan out into a dozen tool calls. Here's how a few of my sessions actually go.
4.1 Set up my morning
I type: "Open ES and NQ on 5-minute charts, add Volume Profile and Footprint to each, and open a SuperDOM for ES." Behind that one sentence the assistant calls open_chart twice, add_indicator four times, and open_superdom once. The charts open, the indicators land, the ladder comes up. Thirty seconds, no clicking. If I add "and screenshot both so I can eyeball the overnight range," it calls screenshot_chart and hands me two images to glance at before the open. Some mornings I start with "connect my data feed first," which just adds a connect_connection call to the front.
4.2 Where do I stand
"List my accounts, my open positions, and my working orders, then summarize my risk." That's list_accounts, list_positions, and list_orders in one go. It tells me my margin used and unrealized P&L per account, what I'm holding, what's resting, and flags if I'm carrying more size than usual. Because every tool here is read-only, there's zero chance of it touching anything while I'm just checking. If a realized number is missing, it says so rather than pretending I'm flat, because that value comes back as null when the venue hasn't reported it.
4.3 Manage a live trade
"What's my ES position? Flatten half and keep the bracket on the rest." It reads the position with list_positions, then uses place_trade to close part of it through the chart's own Close button, leaving the ATM bracket protecting what's left. It reports the account mode it acted on, so I always know whether that hit LIVE or SIM. Before the fact I'll often confirm the setup with "which account is this chart on and what bracket is armed?", which is just get_account and get_atm. If I want to arm a different template first, "set the 2-point stop bracket here" calls set_atm before anything trades.
4.4 Vet a strategy idea
"Backtest my mean-reversion strategy from 2022 to 2025, split it 70/30, and tell me if it's overfit." One run_backtest call, and it hands back in-sample and out-of-sample metrics side by side and calls out the gap. If the out-of-sample falls apart, I hear it in one sentence instead of squinting at an equity curve. Then I'll say "now try it with a wider stop and run it again," and the loop continues, no saved clutter because the tool saves nothing.
5. Full reference table of all 32 tools
Here's the scannable version of every SabrTrader MCP tool, grouped by job.
| Group | Tool | What it does |
|---|---|---|
| Workspace & charts | list_windows | List every open window with an id |
| open_chart | Open a live chart for a symbol and period | |
| get_chart | Read a chart's symbol and bar type | |
| set_chart | Change a chart's symbol or bar type, keeping venue, drawings, indicators | |
| close_window | Close any window by id | |
| open_superdom | Open a depth-of-market ladder | |
| configure_superdom | Change a ladder's symbol, grouping, row height | |
| open_market_analyzer | Open a quote board | |
| market_analyzer_add_symbol | Add a row to the quote board | |
| market_analyzer_remove_symbol | Remove a row from the quote board | |
| open_strategy_analyzer | Open the backtest workbench window | |
| screenshot_chart | Capture a chart to an image the AI can view | |
| Indicators | add_indicator | Add an indicator by catalog key, with overrides |
| list_indicators | List indicators on a chart | |
| remove_indicator | Remove an indicator | |
| get_indicator_settings | Read an indicator's parameters | |
| set_indicator_settings | Change an indicator's parameters and recalc | |
| get_indicator_plots | Read an indicator's recent output values | |
| Market data | get_chart_history | Recent OHLCV bars (default 200, up to 5000) |
| get_chart_price | Current forming bar plus live last, bid, ask | |
| Connections | list_connections | List connections and live status |
| connect_connection | Start a live venue session | |
| disconnect_connection | Stop a live venue session | |
| Accounts, positions & orders | list_accounts | Every account with mode, cash, margin, P&L |
| get_account | Read a chart's selected account and options | |
| set_account | Switch a chart's selected account | |
| list_positions | Open positions across accounts | |
| list_orders | Working orders across accounts | |
| Trading & ATM | get_atm | Read a chart's ATM bracket |
| set_atm | Pick or clear a chart's ATM bracket | |
| place_trade | Buy, sell, close, or reverse via the chart's own buttons | |
| Backtesting | run_backtest | Backtest a strategy with in-sample / out-of-sample split |
6. Safety and staying in control
Since this can now place trades, you should understand exactly what "on" means. It's not scary, but it's real.
Loopback only. The server binds to 127.0.0.1. Nothing on your network or the internet can reach it. The AI client has to be running on the same machine, full stop. There's no remote access to turn on and no port exposed to anyone else.
Off by default. A normal launch never opens the port. You turn it on deliberately in Preferences, and it only runs while SabrTrader is open. Close the app and the server is gone.
It can trade, within your rules. Because
place_trade,set_account, and the connection tools exist, treat "on" as "I'm letting an AI on this machine drive my platform, including orders on the account my chart is set to." It can't bypass your risk limits, your wind-down limits, or your brackets. Those apply to the AI exactly as they apply to you, because every trade goes through the same buttons you'd click.
My practical advice, and it's the same advice the product team gives: while you're exploring, point your charts at a PAPER or SIM account. Keep an ATM bracket selected so every entry gets a stop automatically. Switch to a LIVE account only when you actually mean to trade live. You can always confirm the state first with "which account is this chart on and what bracket is armed?" before you hand over a trade.
Turning it off is one toggle, the same place you turned it on: Settings > Preferences > MCP Server. Flip it off, and the next launch won't open the port.
7. FAQ
Can it actually place real trades?
Yes. place_trade can buy, sell, flatten, or reverse. It does it by clicking the chart's own Buy, Sell, Close, and Reverse buttons, so it uses the account the chart is set to, respects your ATM bracket, and obeys your risk and wind-down limits. If your rules would block a trade, they block it here too. It always tells you whether it acted on LIVE, PAPER, or SIM.
Can it get around my risk limits?
No. Every trade goes through the same path as a manual click, which means your risk limits, wind-down limits, and brackets all still apply. There's no back door that skips them, and the AI can't invent order types you don't already have.
Can it reach my platform over the internet?
No. The server only listens on 127.0.0.1, which is your own machine. Nothing on your network or the wider internet can connect to it. The AI client has to be local.
How do I keep it from trading live by accident?
Point your charts at a PAPER or SIM account while you explore. place_trade acts on whatever account the chart is set to, so if that's a paper account, nothing hits your live money. Keep an ATM bracket armed too, so any entry comes with a stop. Switch to live only when you mean it.
Does it work with Claude Desktop or Cursor?
Yes. It's a standard MCP server, so any MCP client connects the same way. Point Claude Desktop, Cursor, or Claude Code at the same local URL and you're set.
Do I need to keep SabrTrader open?
Yes. The server lives inside the app. When SabrTrader is closed, the server isn't running and nothing can connect.
Will a backtest change or save anything?
No. run_backtest is read-only and saves nothing. You can run as many variations as you like without cluttering your saved strategies. Judge the results on the out-of-sample numbers.
How do I turn it off?
Settings > Preferences > MCP Server, flip the toggle off. It's off by default anyway, so a fresh install never opens the port until you say so.
8. Where to go next
Turn the toggle on, run the one command, and ask your platform to open a chart. That's the fastest way to feel what this is. Once you're comfortable, the real fun is chaining asks together: set up your workspace, check where you stand, vet an idea, and place a trade, all in the same conversation with one AI trading assistant.
If you want to go further, build something the AI can drive. The first-indicator guide and the first-strategy guide both produce something you can then control by voice through the MCP server. For the bigger picture, see the features and SDK pages, or check pricing when you're ready to run it for real.